Dashboard : Performance Tab
The Dashboard Performance tab shows the user's activity over the current calendar month, previous calendar month and past year(12 calendar months). The data is displayed over a number of charts and split over two groups:
- Overview
- velocity
The Overview section is then split into four sections:
- Billable hours
- Share of Billable Time
- Velocity
- , &
To view the Performance tab, do the following:
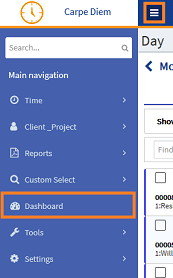
- From the Navigation menu select: Dashboard.
- This will open the Dashboard view.
To view the Performance tab and Overview graphs, do the following:
 Billable Hours
|
 Performance tab : By default the Performance tab is selected and shows two sub tabs, Overview and Timekeeper velocity. Performance tab : By default the Performance tab is selected and shows two sub tabs, Overview and Timekeeper velocity.
 Overview accordion : Click the + button in the accordion to expand the view. Overview accordion : Click the + button in the accordion to expand the view.
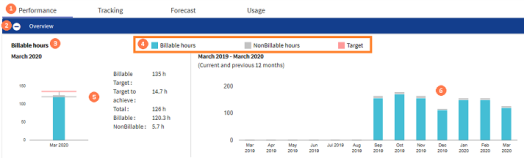
 Billable hours : The first group of charts show your billable hours for the current calendar month and for current and previous 12 calendar months, so 13 months in total. Billable hours : The first group of charts show your billable hours for the current calendar month and for current and previous 12 calendar months, so 13 months in total.
 Graph key : Colour representation key. Graph key : Colour representation key.
 Current month : chart : The chart on the left shows you your current billable and non-billable time that you have recorded. The firm's targets and your actual recorded time values are listed to the right of the chart. This chart does not show any pop-up values on hovering the cursor. Current month : chart : The chart on the left shows you your current billable and non-billable time that you have recorded. The firm's targets and your actual recorded time values are listed to the right of the chart. This chart does not show any pop-up values on hovering the cursor.
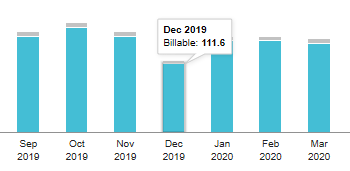
 Data : Past year to date : chart : This chart shows a values pop-up when hovering you cursor over the different colours in the bar chart. This will show you the billable and non-billable hours you have recorded. Data : Past year to date : chart : This chart shows a values pop-up when hovering you cursor over the different colours in the bar chart. This will show you the billable and non-billable hours you have recorded.
|
Share of Billable Time details
|
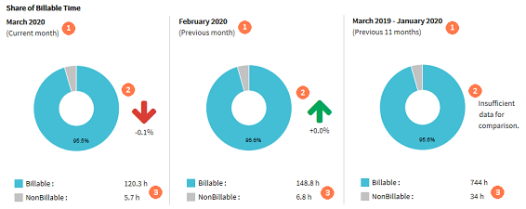
Period displayed : The labels above each chart will show you which calendar month the billable and non-billable time is displaying.
Period chart and comparison details : Hovering your cursor over each doughnut will show you your hours and percentages where both values are not displayed.
Breakdown of Billable & Non-billable hours : Colour representation key and value totals.
|
Velocity details
|
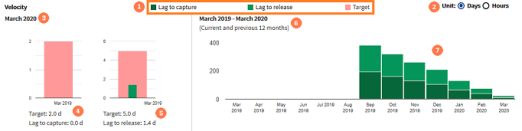
Velocity key : Colour representation key.
Unit : By default the graphs are displayed in units of Days. Click the Hours radio button to change the graphs to show the data in units of Hours.
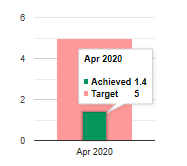
Current month data : The timekeeper's velocity charts in the left section, will always display the current calendar month data.
Lag to capture : target : The chart will display the target number of days or hours, for your lag to capture. This is the time it took to enter the time since the time the work was done. E.g. you completed the work on Monday but you did not create the time entry until Wednesday. Here the lag would be 2 days.
Hovering your cursor over the graph will display the values in a pop-up.
Lag to release : target : The chart will display the target number of days or hours, for your lag to release. This is the time it took from saving the time entry to submitting it. E.g. you created the time entry on Wednesday but you did not submit until Friday. Here the lag would be 2 days.
You can hover the cursor over the graph to display the values in a pop-up. (This is illustrated in the image in step 4 above.)
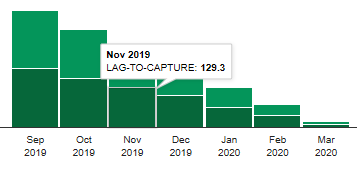
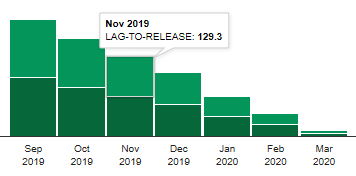
Current and previous 12 Months data : The data captured in this chart will show the lag to release and the lag to capture for each month over a 13 month period. This is the current calendar month and the previous 12 calendar months.
 Worked period in bar chart : Where there are bars in the chart they will be split to show lag-to-capture below the lag-to-release values. You can hover the cursor over the graph to display the values in a pop-up. (This is illustrated in the 2 images below) Worked period in bar chart : Where there are bars in the chart they will be split to show lag-to-capture below the lag-to-release values. You can hover the cursor over the graph to display the values in a pop-up. (This is illustrated in the 2 images below)
|
Lag details
|
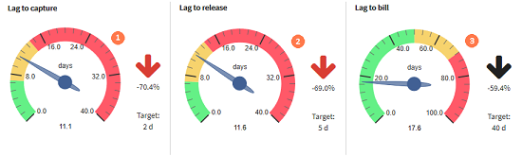
Lag to capture : Gauge 1 : Shows your lag to capture. The Target that the firms set as the number of days you should take to enter your time since you completed that work. In this image that is 2 d, the gauge shows that it actually took 11.1 days. This is over by 70.4% of the expected time. Ideally you should see the pointer in the green area, but this image is showing you that you have taken too long as the pointer is in the yellow area.
Lag to release : Gauge 2 : Shows your lag to release. The Target that the firms set as the number of days you should take to submit your time from the time you recorded it. In this image that is 5 d, the gauge shows that it actually took 11.6 days. This is over by 69.0% of the expected time. Ideally you should see the pointer in the green area, but this image shows that you have taken too long, as the pointer is in the yellow area.
Lag to bill : Gauge 3 : Shows your lag to bill. The Target that the firms set as the number of days it should take to bill your time to the client since you submitted your time. In this image that is 40 d, the gauge shows that it actually took 17.6 days. This is under by 59.4% of the expected time. In this image you can see that the pointer is in the green area.
|
To view the Performance tab and Timekeeper Velocity table, do the following:
Timekeeper's velocity
|
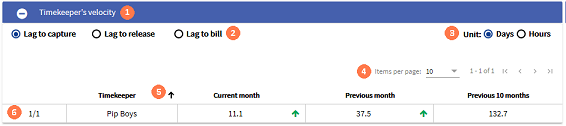
Timekeeper's velocity accordion : Click the + button to expand the view and display the timekeeper's velocity table.
Lag options : By default the Lag to capture option is selected. To change the table data to show the Lag to release or Lag to capture details, click the required radio button.
Unit options : By default the units are displayed in Days. To change this, click the Hours radio button.
Paging options : Where you have selected multiple timekeeper's or group's and there are more than 10 rows of results displayed, you can increase the number of rows per page. Click the down arrow and select the required option from the drop-down list. Where there is more than 1 page of results, click the < > arrows to scroll one page at a time. Alternatively the >| button will jump to the last page and |< will jump to page 1.
Sort by : You can sort the table in ascending or descending order by click in on the arrow in the timekeeper column header.
Results table : The results are displayed for each timekeeper or group in the row.
|
Now see :
Dashboard : Setting the Timekeeper
Dashboard : Tracking Tab
Dashboard : Forecast Tab
Dashboard : Usage Tab